
Data Caveats
Data limitations to keep in mind, by dataset and event type.
Data accessed through the GFW APIs is as accurate as possible, but should be used with the caveats below in mind.
Apparent fishing effort
-
Interpreting apparent fishing effort: Our general fishing model estimates fishing-related activity and is intended to reflect a range of fishing-related behaviors—such as searching or preparing gear—not just gear deployment or retrieval. These estimates should not be interpreted as precise records of gear setting or hauling.
-
False positives: AIS-based models identify fishing based on movement patterns. As with any model, there can be false positives. False positives may appear in the dataset where vessels slow down and change direction, but aren’t engaged in fishing activity. We are continuously working on reducing false positives and this should be reflected in future data releases.
-
Bias in vessel identification and gear classification: Misclassifications in vessel type may occur due to inconsistent or incomplete vessel registry data. Misclassifications can happen when algorithms struggle to appropriately categorize vessels, for instance, where vessels use several gears (thus changing their behavioral patterns) or when a vessel’s MMSI (maritime mobile service identity) number is used by more than one vessel, then MMSI recycling may result in misclassification of vessel type by our vessel classification model. Misclassification of vessel type can result in the unexpected presence or absence of vessels in the apparent fishing effort estimates.
-
Apparent fishing events vs apparent fishing effort: Apparent fishing events group consecutive apparent fishing positions into summarized events for easier visualization. They apply filters based on time, distance, and vessel behavior, which can exclude some fishing positions. As a result, apparent fishing events and apparent fishing effort may differ, especially when fishing activity is spread out over long distances or time gaps.
We recommend you check this page for full details on this datasets and their limitations.
For apparent fishing events, check the section below.
AIS Vessel Presence caveats
Global Fishing Watch uses data about a vessel’s identity, type, location, speed, direction and more that is broadcast using the Automatic Identification System (AIS) and collected via satellites and terrestrial receivers. AIS was developed for safety/collision-avoidance. The AIS Vessel Presence dataset displays a gridded data of vessel presence for any vessel type (not just fishing). The presence is determined by taking one position per hour per vessel from the positions transmitted by the vessel's AIS.
Data caveats should be considered as this is based on AIS which has its own limitations, see AIS Limitations from this page.
IMPORTANT: this overall dataset is huge, for analysis, it's highly recommended to request short periods of time to manage the data volume effectively.
How are the events estimated?
The automatic identification system (AIS) data is obtained from a combination of commercial and government sources. Learn more. The data is then used to estimate vessel identity and activity, including apparent fishing,encounters, loitering events, and port visits.
Any and all references to activity events, including fishing, encounters, loitering, AIS off (aka GAP) and port visits should be understood in the context of Global Fishing Watch's algorithms, which are best efforts to determine apparent vessel activity events based on AIS data collected via satellites and terrestrial receivers. As AIS data varies in completeness, accuracy and quality, it is possible that some events are not identified. It is also possible that some events are identified but are incorrect or do not indicate actual fishing, transshipment, or port access. For these reasons, Global Fishing Watch qualifies all designations of events, including synonyms of event terms such as "fishing effort," "fishing" or "fishing activity," as apparent rather than certain. Any/all Global Fishing Watch information about apparent events should be considered an estimate and must be relied upon solely at your own risk. Global Fishing Watch is constantly improving processes to make sure event algorithms and designations are as accurate as possible.
Encounter event
Encounter events describe when AIS data shows two vessels that appear to be meeting at sea. Encounter events can be indicative of potential transshipment events. Check what vessel types are available in the API here. Global Fishing Watch records an event as an encounter when the estimated positions of two vessels suggest they were within 500 meters of each other for a duration of at least two hours. The positions are not derived directly from raw AIS messages, but from raw AIS positions that are interpolated and extrapolated onto a 10-minute time grid using the reported course and speed of each vessel. The reason for the interpolation is that the vessels broadcast at irregular intervals. Therefore, the 500-meter proximity is a calculation based on these modeled positions, not on direct measurements, which means the event itself has a degree of uncertainty. The encounters displayed on the map are pre-filtered based on specific criteria. For a full list of these filters, please refer to the information popup for the encounter. In contrast, the API provides the flexibility for users to apply their own filters. Check more details here.
You can read more about transshipment behavior from our report or scientific publication.
Loitering event
Loitering is when a single vessel exhibits behavior indicative of a potential encounter event. It is possible that loitering events do not indicate a potential transshipment. For example, other events in which a vessel may remain fairly stationary include maintenance or waiting outside of port for permission to dock. AIS data is used to calculate loitering events based on vessel speed and distance from shore. Loitering occurs when a vessel travels at an average speed of less than 2 knots, while at least an average of 20 nautical miles from shore. Due to the individual definitions of loitering events and encounter events, it is possible for a loitering event to overlap with an encounter event, representing the same activity, or the loitering event may encompass one or more encounter events.
Check more details here
Port visit events
Movements in and out of a port are automatically detected by Global Fishing Watch and categorized according to four distinct types of events: port entry, port stop, port gap (i.e. a gap in AIS transmission while in port) and port exit. When at least two of these events occur, then a port visit is detected. Therefore, a port visit occurs when a vessel has a port entry, a port stop or port gap, and potentially followed by a port exit event, depending on the confidence of the port visit (see next question on how port visit confidence is determined). This means the vessel is within 3 km of an anchorage (port entry), and is moving between 0.5 and 0.2 knots (port stop), or is within an anchorage but has a gap in AIS transmission for at least 4 hours (port gap), and then the vessel transits more than 4 km outside of the anchorage point (port exit). Ports are based upon the Global Fishing Watch anchorages dataset, a global database of anchorage locations where vessels congregate. More information on anchorages can be found here.
Confidence levels of a port visit
- A port visit with low confidence (level = 2) indicates that only a port stop or gap event was detected using AIS within the port.Only a port stop OR gap was identified based on AIS transmission.
- Medium confidence (level = 3) indicates that a port entry or exit was detected using AIS, along with a stop or gap within the port.
- High confidence (level = 4) indicates that the vessel was identified using AIS with an entry, stop or gap, and exit within port. A port visit with a lower confidence may sometimes be a false port visit caused by noisy AIS transmission and requires a further inspection of the vessel tracks.
Definition of each port event:
-
PORT ENTRY: vessel that was not in port gets within 3km of anchorage point
-
PORT STOP: begin: speed < 0.2 knots; end: speed > 0.5 knots
-
PORT GAP: AIS gap > 4 hours; start is recorded 4 hours after the last message before the gap; end at next message after gap.
-
PORT_EXIT: vessel that was in port moves more than 4km from anchorage point
Apparent fishing events
Global Fishing Watch analyzes AIS data collected from vessels that our research has identified as known or possible commercial fishing vessels, and applies a fishing detection algorithm to determine “apparent fishing activity” based on changes in vessel speed and direction. The algorithm classifies each AIS broadcast data point for these vessels as either apparently fishing or not fishing and shows the apparent fishing effort on the Global Fishing Watch map. Fishing events use those data points as input and summarize them into one event for easier analysis. Fishing events are defined using the following restrictions:
-
Consecutive positions identified as fishing are grouped together into a single event
-
Fishing positions which appear consecutively, but are 10 km apart or more than 2 hours apart are separated into distinct events.
-
Fishing events within 1 hour and 2 km of another fishing event but possibly having intermittent transit points are grouped together into a single event.
Finally, the dataset is restricted by removing fishing events that are brief and fast, as these are less likely to indicate a realistic fishing event. The following short fishing events are removed:
-
Events less than 20 minutes
-
Events comprised of five or fewer positions;
-
Events that cover distance of less than 0.5 km (for all gears except estimated squid gear)
-
Events that cover distance of less than 50m (for estimated squid gear)
-
Abnormally fast moving vessel events with an average vessel speed of 10 knots or greater
We recommend you check this page for full details on apparent fishing events.
Check more details about difference between fishing effort and fishing events here.
Learn more about apparent fishing effort here and here.
AIS Off Event (aka GAP)
AIS devices are designed to continually broadcast a vessel’s position in order to serve as a collision avoidance system. It is not uncommon to observe hundreds or thousands of AIS positions for a vessel in a single day. Thus, when a vessel has an extended gap in AIS positions it can potentially indicate suspicious behaviour. However not all AIS signals broadcasted are received by satellite or terrestrial AIS receivers and thus it is inherently concerning to observe transmission gaps in a vessel’s AIS signal that are many hours long, especially in certain areas. Satellites must be overhead and terrestrial receivers require line of sight to receive AIS messages. When AIS messages may overlap in time, especially in areas of high vessel density, signal interference may result and prevent messages from being received by satellites. Subsequently, GFW records all AIS gap events over six hours (referred to as “naive gaps” and then uses a set of filters to identify those gaps we believe could be a cause of intentional AIS disabling.
To identify AIS gaps that are most likely due to intentional disabling rather than technical issues, GFW developed a classification model based on the following rules, which are explained in more detail in the Known Issues section below:
-
The gap event must be at least 12 hours
-
The gap must start at least 50 nautical miles from shore
-
The gap must start in an area with a satellite reception quality greater than 10 positions per day
-
The vessel must have at least 14 satellite positions in the 12 hours prior to the gap
Known Issues
-
Gap events less than 50 nautical miles from shore are unreliable due to differences in satellite and terrestrial AIS. Satellite AIS reception generally decreases closer to shore as high vessel densities lead to signal interference. At the same time, >99% of GFW’s terrestrial AIS messages are less than 50 nautical miles from shore - generally the upper range of terrestrial AIS receivers - and terrestrial AIS coverage varies considerably around the world. Through a combination of these factors, AIS gaps that start within 50 nautical miles could be due to numerous technical reasons, such as:
-
Transitioning from areas with terrestrial AIS coverage to poor satellite AIS reception
-
Poor satellite reception while approaching port followed by turning off AIS upon arrival. These situations are likely responsible for many of the very long AIS gaps (e.g. several months) in the data
-
-
Gaps shorter than 12 hours are unreliable due to satellite periodicity. The number of satellites over the horizon at different places on earth varies considerably hour to hour. At all latitudes under 60, the major peak is at 12 hours (one half a day) and the standard deviation of the number of satellites overhead is very high when considering time periods under 12 hours. For this reason, only gaps >=12 hours can be considered intentional disabling events. The 12 hour threshold accounts for the approximate amount of time required for the swath of an individual AIS satellite in a sun-synchronous orbit to cover the same location.
-
Reception Quality: The AIS reception quality estimates currently used in identifying these events are based on data for 2017-2019 from Welch et al. (2022) while we work to automate monthly reception quality estimates from then onwards.
Vessel API - Vessel identity information
- Vessel identity data is extracted from over 40 registries available either in the public domain or from authorities and researchers, including registries from regional fisheries management organizations, national registries, and lists compiled by researchers. Each of the lists has been obtained regularly since early 2019 and supplemented, when possible, with historical data to provide snapshots of a registry and its vessels over time.
- Even if vessel identities are matched to authorization lists, the vessels are only potentially authorized, as we can verify only that they were authorized to fish in that region and cannot verify that they were compliant with regulations on target species or catch quantities.
- Whether fishing by some of these vessels was truly unauthorized cannot be known, as public records may be incomplete or outdated, and in some regions, fishing is simply not internationally regulated.
Vessel Types
For vessel type a research and analysis is conducted in addition to using the original AIS data to identify the most likely value. Global Fishing Watch developed a carrier database and bunker database that is curated using a combination of sources, including: major RFMO vessel registry lists, publicly available national public registries, the IMO number, and a convolutional neural network—machine learning algorithm—used to estimate vessel class, as well as web and search images.
-
The fishing vessels identified from Global Fishing Watch come from its fishing database, which is collated using vessel public registry databases, reported AIS identity information, and estimated classification using a machine learning algorithm.
-
The passenger, seismic, cargo, and gear vessel classes identified from Global Fishing Watch come from its vessel database which is collated using vessel registry databases and estimated classification using a machine learning algorithm.
-
All support vessels are considered purse seine support vessels based on internal review.
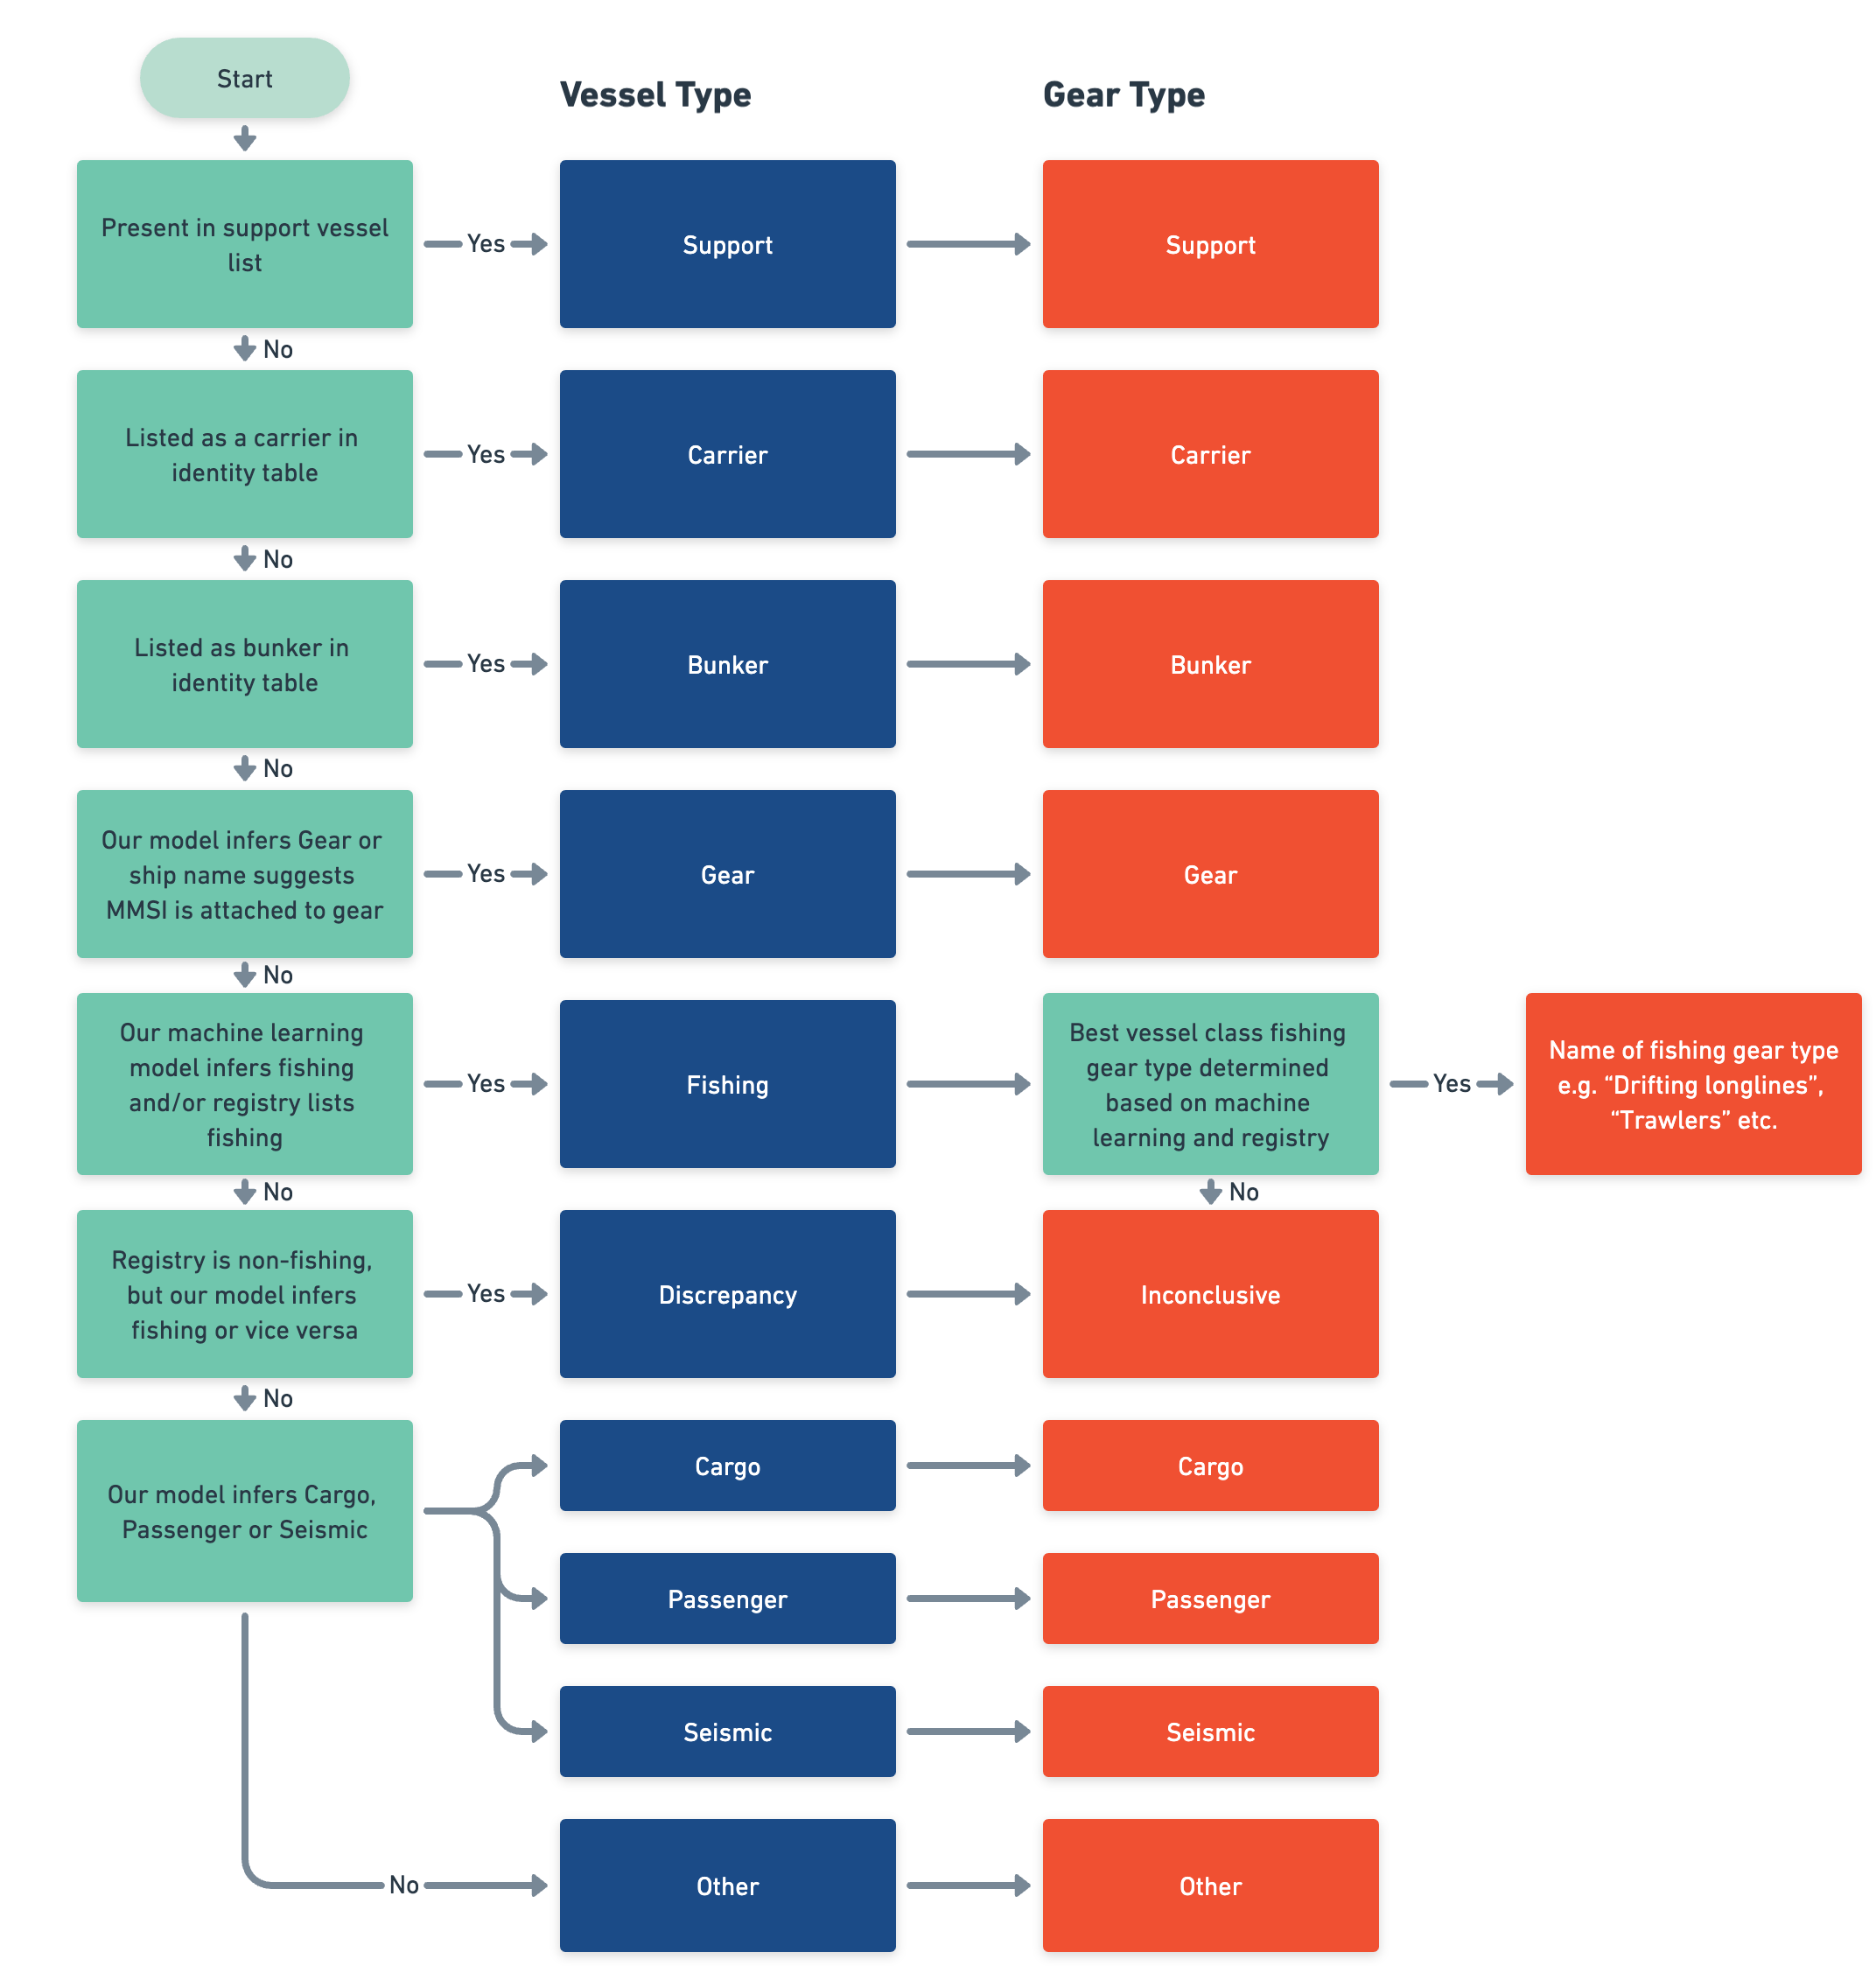
Learn more about Global Fishing Watch vessel classes here.
Learn more about the list of vessel registries that we have here
Why am I seeing multiple ids when I search for a vessel?
Using Vessel API version 3, you get results from public registries inside object registryInfo, AIS self reported data inside object selfReportedInfo and a mix of sources (AIS, Registry and GFW machine learning models) inside object combinedSourcesInfo.
So why do I see multiple ids inside selfReportedInfo?
When processing AIS positions Global Fishing Watch algorithms try to match AIS position messages with AIS self-reported identity messages to assign vessel tracks throughout time to the correct vessel identity. When there is a new identity reported, Global Fishing Watch creates a new record.Often times, a new identity is reported when a vessel does have a real identity change (e.g, the vessel went to port where it changed its flag State and name). However, there are instances when the vessel simply changes the way it is transmitting on AIS. For example, a vessel will often transmit its name, IMO, MMSI, and callsign, but for a period of time it only transmits its MMSI and not the other identity values, which results in multiple identities for a single vessel.
- Search by Name = GABU REEFER and IMO = 8300949
- Vessel API returns 3 results:
| Vessel Id | Name | IMO | MMSI | CALL SIGN | AIS TRANSMISSIONS |
|---|---|---|---|---|---|
| 1da8dbc23-3c48-d5ce-95f1-1ffb6cc00161 | GABU REEFER | 8300949 | 613590000 | TJMC996 | Jan 24 2022 to Oct 19 2023 * (this last date will be updated depending on when do you make the call to the Vessel API) |
| 0b7047cb5-58c8-6e63-4bfd-96a6af515c91 | GABU REEFER | 8300949 | 214182732 | ER2732 | Feb 22 2019 to Sept 19 2022 |
| 58cf536b1-1fca-dac3-ad31-7411a3708dcd | GABU REEFER | 8300949 | 616852000 | D6FJ2 | Jan 02 2012 to Feb 23 2019 |
- In this example even though they are the same physical vessel, the identity reported in AIS
selfReportedInfois different. - The records show the vessel under the same IMO, however the vessel did not consistently transmit the same identity values. In this example, the vessel was likely transmitting under a different MMSI, different call sign and possibly a different owner.
With Vessel API version 3, you can link all these vessel ids since they are related to the same vessel from the information GFW pulled from the public registries that you can find under the object registryInfo.
Exclusive economic zone boundaries definition
Exclusive economic zones (EEZs) extend up to 200 nautical miles from a country's coast. EEZ boundaries are shown as solid lines for “200 NM”, “Treaty”, “Median line”, “Joint regime”, “Connection Line”, “Unilateral claim (undisputed)” and dashed lines for “Joint regime”, “Unsettled”, “Unsettled median line” based on the “LINE_TYPE” field. For more detail on the methodology to create these boundaries, check https://marineregions.org/eezmethodology.php Source: marineregions.org. Flanders Marine Institute (2019). Maritime Boundaries Geodatabase: Maritime Boundaries and Exclusive Economic Zones (200NM), version 11.
Marine protected area boundaries definition
Marine protected areas (MPAs) are areas of the ocean set aside for long-term conservation. These can have different levels of protection, and the range of activities allowed or prohibited within their boundaries varies considerably. Source: World Database on Protected Areas.
What does it mean if an event is within a specific geographic area, such as an EEZ,MPA or RFMO?
For Encounters, Loitering, Port visits and AIS off (GAP) events
An event is considered to occur within a specific geographic area if the mean point of the event intersect with the defined boundaries of the geographic areas referred to as Reference Layers. This determination is made using the point-in-polygon (PIP) method, which assesses whether the mean point of the event falls within, outside of, or precisely on the perimeter of a polygon. Because the mean point of the event is used, it is possible the actual track coordinates do not overlap with the EEZ. Please investigate the highlighted events further on the map.
For apparent fishing events
An event is deemed to take place within a designated geographical region when its tracks intersect with the defined boundaries of the geographic areas referred to as Reference Layers. This determination is made using the point-in-polygon (PIP) method, which assesses whether a specific point along the event's path falls within, outside of, or precisely on the perimeter of a polygon.
It is absolutely recommended to inspect the track manually since it can happen that there are events occurring along a boundary where in many cases the vessel in question was fishing outside/along the EEZ but then barely goes inside the EEZ for a short time. This is why we encourage you to manually inspect vessels fishing in an area they aren’t supposed to be, as while many fishing events happened just barely inside an EEZ, the majority of the activity happened on the high seas. Another example is when the vessel appeared to be transiting and it was a false fishing event, or the activity happened predominantly outside the no take MPA.
How does GFW calculate that an Event has a publicly listed authorization?
Events that have publicly listed authorization information are calculated only for events on the high seas and in the 5 tuna RFMOs (IATTC, ICCAT, IOTC, CCSBT, WCPFC), SPRFMO and NPFC. Events outside these areas, and specifically in EEZs are not flagged as potential risks because Global Fishing Watch doesn’t have national registries in the database. In the future, we are exploring adding other RFMOs, contact support@globalfishingwatch.org for any recommendation. The system only keeps the records where the authorization interval overlaps with the activity interval of the vessel(s) in the event.
Understanding authorization fields in the API:
Fishing events: .
-
PUBLICLY_AUTHORIZED: if there is authorization record for vessel in RFMO where event occurred at time of the event. If an event occurred in the RFMO overlap area, if the vessel is authorised to one or more of the RFMOs where the event occurred, then it is PUBLICLY_AUTHORIZED.
-
NOT_MATCHING_RELEVANT_PUBLIC_AUTHORIZATION: if there is no authorization record for vessel in RFMO or RFMO overlap area where event occurred at time of event.
-
PENDING_INFO: if an event occurred after the last registry scrape date (generally in the past month) then the event may be PENDING_INFO, as there is not up to date authorization records.
-
potentialRisk: true if PUBLICLY_AUTHORIZED is false and the event is not in EEZ. If vessel is in EEZ we do not flag events as potentialRisk as we do not have national registry lists.
Encounter events:
-
PUBLICLY_AUTHORIZED: Based on joint public authorization status. If both vessels in the encounter are publicly authorised to the same RFMO where the event took place, the event is PUBLICLY_AUTHORIZED. If the encounter is in an RFMO overlap area, both vessels must be authorised to all the RFMOs.
-
NOT_MATCHING_RELEVANT_PUBLIC_AUTHORIZATION: If the encounter is in an RFMO overlap area, both vessels must be authorised to at least one of the RFMOs. If the vessels in the encounter are authorised, but to different RFMOs, the vessel is flagged as a potential Risk (eg a carrier flagged to SPRFMO and fishing vessel flagged to IATTC would not be authorised to transship the same fish species).
-
PENDING_INFO: if an event occurred after the last registry scrape date (generally in the past month) then the event may be PENDING_INFO, as there are not up to date authorization records.
-
PARTIALLY_MATCHED: If the encounter is in an RFMO overlap area, both vessels must be authorised to at least one of the RFMOs.
-
potentialRisk: when the event has NOT_MATCHING_RELEVANT_PUBLIC_AUTHORIZATION and the event is not in EEZ then, potentialRisk is true. If the event is in EEZ we do not flag an event as potentialRisk as we do not have national registry lists.
Important caveats
-
Even if a vessel is PUBLICLY_AUTHORIZED from the registry the vessel should be verified by the user for the specific vessel activity of interest.
-
The logic GFW implemented for authorization is not the same as GFW Carrier Vessel Portal
What does it mean that an API Dataset is in Prototype stage?
It means it is still under quality assurance processes and there may be inaccuracies, or issues within the data that have not been resolved yet. It may also not reflect the most recent or up-to-date information, and new data points or changes in the data may not be included.
Insights API: Fishing detected in no-take MPAs
For details on how an Fishing event is estimated, please refers to our Data Caveats.
To create this indicator, apparent fishing events are cross-referenced with the boundaries of no take MPAs (see source here) to create this indicator. If our algorithms have detected apparent fishing activity within the boundaries of a no take MPA, then this is flagged in the API result.
Caveats: Events close to boundary lines may be reported as being inside a boundary when, in fact, they occurred outside of it. We recommend that you check the vessel positions on the Map alongside adding the MPA layer to see the boundaries and confirm exactly where the vessel was operating.
Insights API: Fishing event detected outside known authorized areas
For details on how an Fishing event is estimated, please refers to our Data Caveats.
To create this indicator, apparent fishing events are cross-referenced with authorization information that Global Fishing Watch has compiled from 7 RFMOs (CCSBT, IATTC, ICCAT, IOTC, NPFC, SPRFMO, and WCPFC) to create this risk indicator. If a vessel is believed to have fished in an RFMO where, based on our information, there is no known authorization, then this is flagged in the risk summary.
Caveats:
-
Events close to boundary lines may be reported as being inside a boundary when, in fact, they occurred outside of it. We recommend that you check the vessel positions on the Map to see the boundaries and confirm exactly where the vessel was operating.
-
This indicator only covers RFMO authorizations, it does not cover national registration or licensing lists as we do not have access to national databases at this time.
-
We make our best effort to provide the most accurate and up-to-date information possible. However, sometimes there can be delays, reporting or administrative errors that result in the incorrect information displayed, both at the RFMO and in Vessel Viewer. For this reason, we always recommend you refer to additional data sources or request authorization records from a vessel to confirm any findings.
Insights API: Coverage
The coverage metric is an estimate of how well a vessel's activities, i.e. where it travelled and what it did, can be captured by the vessel’s Automatic Identification System (AIS) tracking data. The transmission of AIS during a vessel’s voyage, excluding port visits, provides the vessel’s location data, speed, and identity data. The more frequently a vessel transmits this information, the more our algorithms can characterize their activity, including fishing, encounters and loitering, and AIS off events. To calculate the coverage metric, all voyages linked to a vessel in the selected time range are segmented into one hour blocks and the total number of blocks with at least one AIS transmission are counted. The coverage metric is a percentage representing the proportion of one hour blocks a vessel is in a voyage and has at least one AIS transmission. You can read more about our work on transmission gaps here.
An ‘NA’ value for coverage is because there is no reported activity for that vessel in the selected time range. This could be because of poor coverage but may also be the result of inactivity (e.g. the vessel was undergoing maintenance and had no voyages during the selected time range). In these cases, we recommend you check additional information sources and request supporting records from the vessel.
The AIS coverage metric is critical to interpreting vessel activity information. The higher the coverage, i.e. percentage, the greater confidence you can have that the activities listed are an accurate representation of the vessel’s activity. Conversely, the lower the coverage, the less confidence you can have that the activity summary represents the vessel’s actual activities. Because the coverage metric is calculated based on voyages (e.g. during the period of time the vessel is detected out of port), the coverage should be interpreted as a reflection of the vessel’s AIS reception quality while out at sea, and not reflective of AIS during port visits.
Caveats:
-
Coverage only calculated during voyages: The coverage calculation is limited to the period of time a vessel is detected in a voyage (e.g. the activity of a vessel out at sea, between port visits). This means that if a vessel is detected in port, this activity the vessel is active on AIS will not be factored into the coverage calculation. Some of the reasons for this are: (a) if a vessel is in port for a long period of time with its AIS on, that high coverage may be disproportionate and not reflective of the vessel’s coverage at sea, (b) vessels frequently turn off AIS once in port. If there is an issue detecting port visits for a vessel, this may affect the accuracy of the coverage calculation, given port visits are used to bound the period of time to calculate coverage for.
-
One hour intervals: Coverage is evaluated by looking at the frequency a vessel transmits on AIS at least once every hour. Depending on the use case or the area where a vessel is active, evaluating coverage on one hour intervals may result in low coverage. For instance, in some areas satellite reception may be low, resulting in low coverage subsequently. Fishing vessels frequently transmit Class B AIS, which has a less frequent ping rate that could result in lower coverage. These factors and others are important to consider when trying to understand the value/meaning of the coverage metric.
-
Coverage metric is calculated from January 1, 2017
Insights API - AIS off event (aka GAP)
For details on how AIS off event is estimated, please refers to our Data Caveats - AIS Off Event
Caveats:
-
This indicator only covers AIS off events that are 50 nautical miles or more from shore. Closer to shore, challenges from variable terrestrial AIS coverage and signal interference in crowded waters complicate reliable detection of disabling events.
-
The dataset has attempted to remove gaps that are a result of poor coverage or reception quality and similar factors that are beyond the control of the vessel.
Insights API - RFMO IUU vessel list
The regional fisheries management organization (RFMO) IUU vessel list indicates if a vessel is currently included on any RFMO list of IUU fishing vessels.
The API provides:
-
a counter that shows the number of times the vessel has appeared in an IUU vessel list based on GFW's historical data.
-
Another counter indicating the vessel's appearances in the RFMO IUU vessel list within a specified period, along with the duration of inclusion.
Data Caveats
-
Note that this only refers to the official RFMO IUU vessel lists, including CCAMLR, CCSBT, GFCM, IATTC, ICCAT, IOTC, NAFO, NEAFC, NPFC, SEAFO, SPRFMO, SIOFA, WCPFC. Vessels that have a history of suspected or proven IUU or other non-compliance, but have never been IUU listed by an RFMO will not be flagged in this field.
-
Source data is Combined IUU Vessel List from TMT but GFW has some data gaps from 1 Jan 2017, so these are the dates where we collected information:
-
Sept 25 2017
-
Apr 05 2018
-
every month for 2020 and 2021
-
Jan to Jul for 2022 and Nov 2022
-
Mar, Apr, June to Oct 2023
-
Jan, Mar in 2024 and every month after that
-
We recommend checking the original source for other time ranges and more details about caveats.
Exclusive economic zone boundaries definitions
Exclusive economic zones (EEZs) extend up to 200 nautical miles from a country's coast. For more detail on the methodology to create these boundaries, check https://marineregions.org/eezmethodology.php Source: marineregions.org. Check more details of the source here
Marine protected area boundaries definition
Marine protected areas (MPAs) are areas of the ocean set aside for long-term conservation. These can have different levels of protection, and the range of activities allowed or prohibited within their boundaries varies considerably. Source: World Database on Protected Areas. Check more details of the source here
SAR Vessel Detections Data Caveats
-
False positives can be produced from noise artifacts: Although we have applied sophisticated filters to remove noise (false detections and misclassifications), some false positives may still remain. This is version 1 of the dataset, and we appreciate any feedback to improve the data.
-
Sentinel-1 SAR data does not sample most of the open ocean. However, the vast majority of industrial activity is close to shore. Also, farther from shore, more fishing vessels use AIS (60-90%), far more than the average for all fishing vessels (about 25%). Thus, for most of the world, our detection data complemented by AIS will capture the vast majority of human activity in the global ocean.
-
We do not provide detections of vessels or infrastructure close to shore as it’s difficult to accurately map where the shoreline begins. We do not classify objects within 1 km of shore, because of ambiguous coastlines and rocks. Nor do we classify objects in much of the Arctic and Antarctic, where sea ice can create too many false positives; in both regions, however, vessel traffic is either very low (Antarctic) or in countries that have a high adoption of AIS (northern European or northern North American countries).
-
Vessel detection by SAR imagery is limited primarily by the resolution of the images (~20 m in the case of Sentinel-1 IW GRD products). As a result, we miss most vessels under 15 m in length, although an object smaller than a pixel can still be seen if it is a strong reflector, such as a vessel made of metal rather than wood or fiberglass. Especially for smaller vessels (< 25 m), detection also depends on wind speed and the state of the ocean, as a rougher sea surface will produce higher backscatter, making it difficult to separate a small target from the sea clutter. Conversely, the higher the radar incidence angle, the higher the probability of detection, as less backscatter from the background will be received by the antenna. The vessel orientation relative to the satellite antenna also matters, as a vessel perpendicular to the radar line of sight will have a larger backscatter cross section, increasing the probability of being detected.
-
Vessel length estimates are limited by the quality of ground truth data. Although we selected only high-confidence AIS-SAR matches to construct our training data, we found that some AIS records contained an incorrectly reported length. These errors, however, resulted in only a small fraction of imprecise training labels, and deep learning models can accommodate some noise in the training data.
-
Not all geographies are covered equally. Our fishing classification may be less accurate in certain regions. In areas of high traffic from pleasure crafts and other service boats, such as near cities in wealthy countries and in the fjords of Norway and Iceland, some of these smaller craft might be misclassified as fishing vessels. Conversely, some misclassification of fishing vessels as non-fishing vessels is expected in areas where all activity is dark, such as southeast asia. More importantly, however, is that many industrial fishing vessels are between 10 and 20 meters in length, and the recall of our model falls off quickly within these lengths. As a result, the total number of industrial fishing vessels is likely significantly higher than what we detect. Because our model uses vessel length from SAR, it may be possible to use methods similar to those in Kroodsma et al. (2022) to estimate the number of missing vessels. Future work can address this challenge.
SAR Fixed Infrastructure Data Caveats
-
Sentinel-1 and Sentinel-2 satellites do not sample most of the open ocean.
-
Most industrial activity happens relatively close to shore.
-
The extent and frequency of SAR acquisitions is determined by the mission priorities.
-
For more info see: Paper details
-
We do not provide detections of infrastructure within 1 km of shore
-
We do not classify objects within 1 km of shore because it is difficult to map where the shoreline begins, and ambiguous coastlines and rocks cause false positives.
-
The bulk of industrial activities, including offshore development with medium-to-large oil rigs and wind farms, occur several kilometers from shore.
-
-
False positives can be produced from noise artifacts.
-
Rocks, small islands, sea ice, radar ambiguities (radar echoes), and image artifacts can cause false positives
-
Detections in some areas including Southern Chile, the Arctic, and the Norwegian Sea have been filtered to remove noise.
-
-
Spatial coverage varies over time, which can produce different detections results year on year Example: here. Infrastructure detentions from 2017-01-01 to current are available, and updated on a monthly basis.
-
Labels can change over time The label assigned to a structure is the greatest predicted label averaged across time. As we get more data, the label may change, and more accurately predict the true infrastructure type.
-
Global datasets aren’t perfect
- We’ve done our best to create the most accurate product possible, but there will be infrastructure that isn’t detected, or has been classified incorrectly. This will be most evident when working at the project level.
- We strongly encourage users to provide feedback to the research team so that we may improve future versions of the model. All feedback is greatly appreciated.
How is a vessel's "flag" assigned in apparent fishing effort data?
- AIS data uses the first three digits of an MMSI, known as maritime identification digits (MID), to indicate a vessel’s flag State, but since operators manually input MMSI codes, errors are common.
- Invalid MID codes can obscure a vessel’s flag State, affecting thousands of MMSI in the dataset, the vast majority of which operate almost exclusively in the waters around East Asia.